

A systems architect's role is to communicate a vision through diagrams, presentations, robust documentation, and other methods. The perfect tool can mean the difference between success and chaos, as even the smallest tool can have a tremendous impact on your productivity and happiness.
Diagrams serve as a powerful common language to document the current state of a system or envision a future one. There are seemingly an infinite number of diagram types and tools, and as with language, you need to decide which one you want to speak.
Among all of the architectural diagramming tools, there are a few that rise to the top. Here are five that you might want to consider. And whichever you pick, remember that good notation is essential to ensuring someone understands what you're trying to convey in a diagram.
C4 model
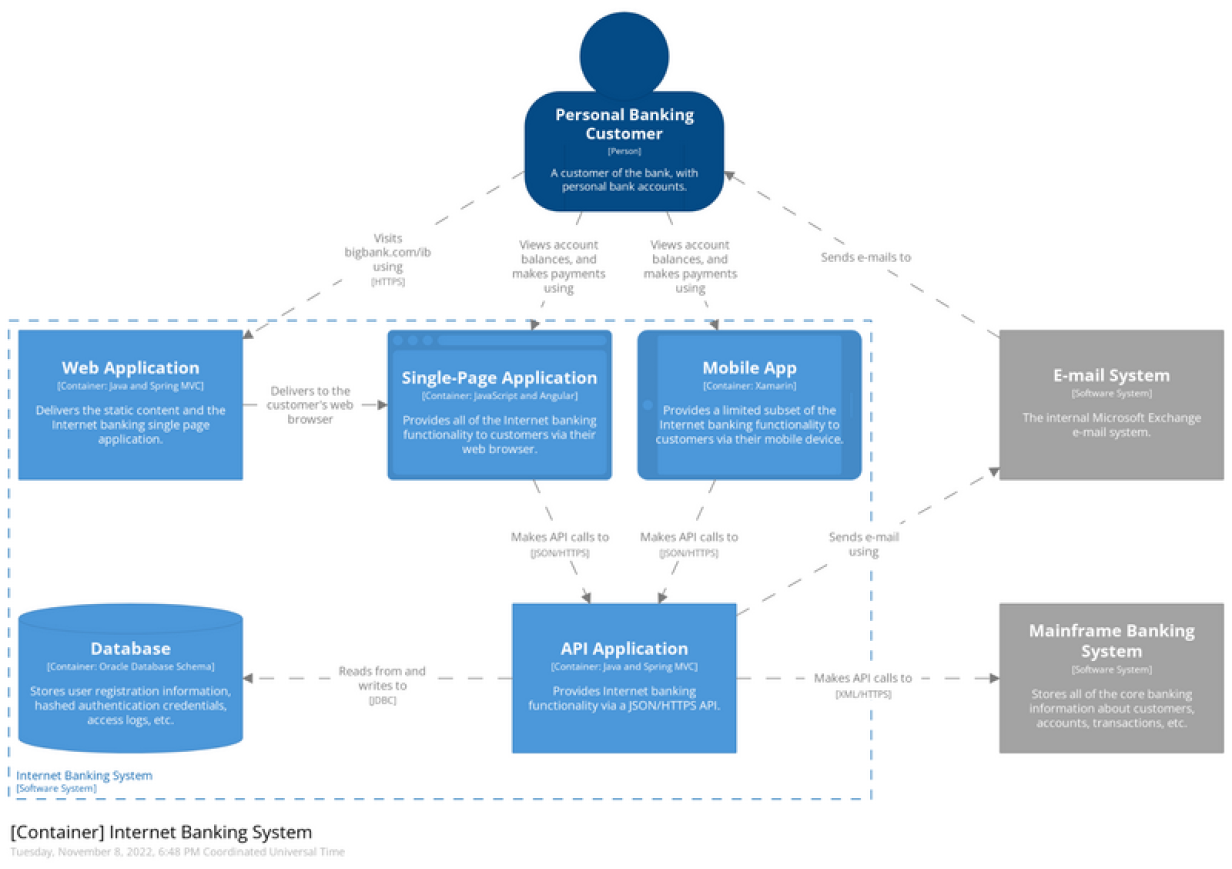
The C4 model (or C4 notation) is a technique created by software architect Simon Brown for modelling the architecture of software systems. Relying on older modelling techniques like Unified Modeling Language (UML) and Entity Relations Diagrams (ERD), C4 breaks a system into architectural building blocks to help explain relationships between things like containers and components.
The C4 model is derived from physical maps: You can look at a location from a high level, like a country, and see your city in the context of other cities and countries. Then you can zoom in to a city level and see major roads and the city's structure. Take another step, and you can see your district or neighbourhood; finally, you might zoom down to a street view. C4 mimics this approach, starting with the general context in which your system works and ending with class diagrams.
Diagrams.net
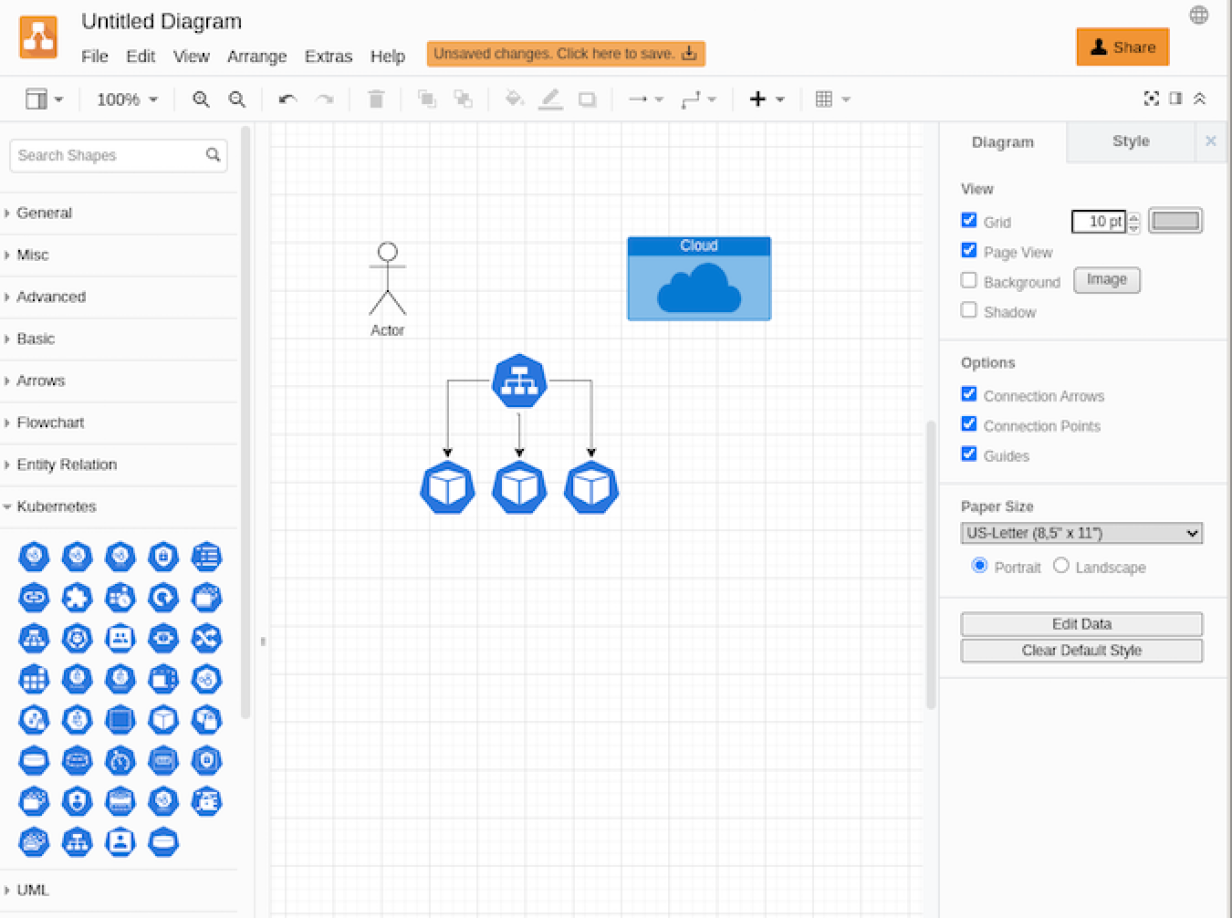
Where do you even begin with Diagrams.net, formerly known as Draw.io? Besides being free of charge, it also has a low learning curve, so anyone can quickly start creating diagrams or whiteboards. Many people use Diagrams.net for diagramming business processes, data flows, and networks. You can also modify elements without having to change the entire diagram with this tool.
Because you can download your diagrams as simple text files, you can save them to standard file storage like Google Drive or a Git repository, create backups, and share. Diagrams.net supports external libraries, including one that implements the C4 model.
Excalidraw
If you're feeling brave and want to try a virtual whiteboard, Excalidraw is an excellent alternative to Diagrams.net. It's especially nice if you appreciate more of a hand-drawn feel. It is not super-flexible, but it is intuitive to start using and has a color set that helps you create good-looking diagrams in no time.
As your system evolves, you must update your diagrams to reflect those changes. Because Excalidraw is a browser-based tool, you have to open a browser tab and make changes visually, which can be inconvenient. You also can't easily see your history of changes. While Excalidraw has fans, I prefer a text-based diagram tool.
PlantUML

PlantUML is an open source tool and syntax that allows you to make sequence, use case, class, object, and other diagrams from code. It also supports non-UML diagrams like JSON and YAML. In addition, it enjoys support from ArchiMate, ERD, Business Process Modeling Notation (BPMN), and other common notation styles. Its simple, plain-text definitions make creating, sharing, and modifying diagrams straightforward. You can store the diagram sources next to your code and update them in the same pull request. PlantUML also supports custom sprites, so you can add icons where they are missing.
Mermaid
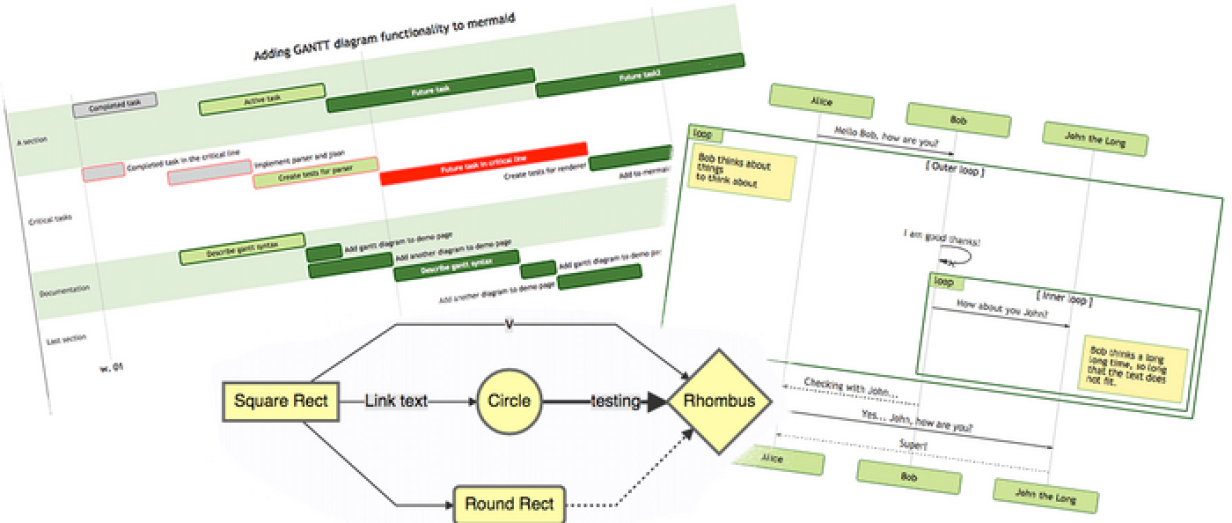
Like PlantUML, Mermaid follows the diagrams-as-code model. It is supported by GitHub and uses Markdown-style notation to create and modify diagrams. This makes diagramming with Mermaid very convenient if you're developing software on GitHub.